Address
304 North Cardinal
St. Dorchester Center, MA 02124
Work Hours
Monday to Friday: 7AM - 7PM
Weekend: 10AM - 5PM
Address
304 North Cardinal
St. Dorchester Center, MA 02124
Work Hours
Monday to Friday: 7AM - 7PM
Weekend: 10AM - 5PM
When someone mentions a “knitting fabric chart,” the immediate assumption is often a sizing guide for a finished sweater or a color pattern for a hand-knit project. While those are useful tools, in the professional world of apparel manufacturing and textile sourcing, the term refers to something far more critical: a technical data sheet that defines the very DNA of a knitted textile. This chart is the primary communication tool between a mill, a designer, and a quality control lab. Misunderstanding it can lead to fabric that fails performance tests, doesn’t drape correctly, or simply isn’t what you ordered. This guide cuts through the ambiguity to explain what a true knitting fabric chart is, how to decode its information, and how to use it to make smarter sourcing and design decisions.
Think of it not as a pattern, but as a fabric’s passport and specification sheet rolled into one. It translates a physical swatch into a set of measurable, repeatable parameters that ensure consistency across production runs, whether you’re ordering 50 meters for a sample or 5,000 meters for full production.
A knitting fabric chart, often called a fabric specification or “spec sheet,” is a standardized document that lists the key physical and structural characteristics of a knitted textile. It is created by the fabric mill after developing a sample and is used to lock in the parameters for bulk production. Its purpose is to eliminate ambiguity. Instead of describing a fabric as “soft and medium-weight,” the chart provides objective metrics that can be verified in a lab.
More advice: Organic Terry Cloth Fabric: A Practical Guide for Buyers and Makers
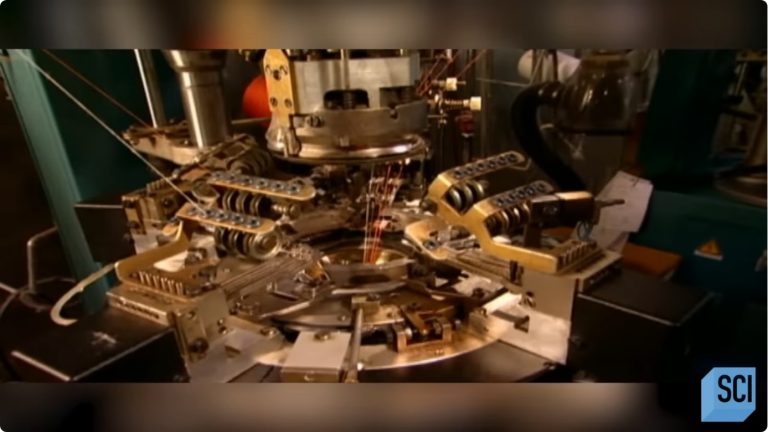
The core of the chart describes the fabric’s construction. This includes the machine gauge (needles per inch), the type of knitting (weft-knit like jersey, or warp-knit like tricot), and the specific stitch structure (e.g., 1×1 rib, interlock, purl). This information is fundamental because it dictates the fabric’s inherent elasticity, stability, and production speed.
A comprehensive chart will include several categories of data. While formats vary by mill, the essential components are largely universal:
Reading the chart is one thing; interpreting it for your application is another. A number in isolation is meaningless. Context is everything.
Weight (GSM) is a starting point, not an endpoint. A 220 GSM jersey in 100% fine cotton will behave entirely differently from a 220 GSM jersey in a 50/50 polyester-cotton blend. The cotton will likely shrink more, feel warmer when damp, and have less inherent crush-resistance than the synthetic blend. Always correlate GSM with fiber content and yarn structure.
Shrinkage is a commitment. The stated shrinkage (e.g., -3% length, -5% width) is the mill’s guarantee based on their tested wash protocol. If your intended garment cut is based on the finished fabric width, you must factor this in. A pattern made for a 150cm wide fabric will be too small if the actual post-shrink width is 142.5cm. For luxury or technical garments where dimensional stability is critical, you may need to request fabrics with “low shrinkage” (often -1% to -2%) or even pre-shrunk options, which will be explicitly noted.
Course length and gauge explain the hand and performance. A longer course length on the same gauge means a larger, more open loop structure. This generally creates a lighter, more drapey, and potentially less stable fabric. A shorter course length creates a tighter, denser, and more stable fabric with less stretch. For activewear, you might seek a specific balance: a high-gauge machine with a moderate course length in a micro-polyester yarn to achieve a lightweight, smooth, and compressive feel.
The chart moves from a piece of paper to a decision-making tool in several key scenarios.
When a mill suggests an alternative fabric, the chart is your comparison tool. Suppose your original spec calls for a 180 GSM, 30/1 cotton jersey with -4%/-5% shrinkage. The mill offers a “similar” 175 GSM, 24/1 cotton jersey. By comparing the charts, you’ll see the coarser yarn count (24/1 vs. 30/1) means a heavier, less smooth hand and potentially different dye uptake. The different gauge might also affect stretch. The chart tells you if the substitution is truly viable or if it represents a significant downgrade in quality or aesthetics.
Also read: Where to Buy Terry Cloth Fabric: A Practical Sourcing Guide
When your fabric shipment arrives, the QC lab uses the chart as the benchmark. They will measure the actual GSM, width, and shrinkage against the spec. They will perform the same abrasion and pilling tests referenced. If the fabric fails to meet the chart’s promised values, you have documented grounds for rejection. The chart is, in essence, your legally binding specification with the supplier.
A common point of confusion is applying woven fabric logic to knits. The following table highlights fundamental differences that your chart must reflect:
| Feature | Knitted Fabric (Chart Focus) | Woven Fabric (Chart Focus) |
|---|---|---|
| Core Structure | Interlocking loops. Primary elasticity. | Interlaced warp/weft threads. Minimal inherent stretch. |
| Key Spec | Gauge, course length, GSM, stretch % (often critical). | Thread count (ends/picks), weave type (twill, plain), GSM. |
| Shrinkage Behavior | Can be significant and variable (length vs. width). Relaxation shrinkage is a major factor. | Generally more predictable, primarily in length (from loom tension). Sanforization is common. |
| Primary Performance Concern | Run-resistance (for sheers), pilling, shape retention after stretch. | Tear strength, slippage, abrasion at seams. |
When sourcing, you cannot use a woven fabric chart to evaluate a knit. The metrics and their implications are fundamentally different.
Before you approve a sample and place an order based on its chart, run through this checklist. The answers will prevent costly mistakes.
A knitting fabric chart is an indispensable tool, but it is not a crystal ball. It describes the fabric in a controlled, tested state. It does not predict exactly how that fabric will behave after 50 home launderings, how it will interact with specific garment dyes and finishes, or how it will perform under the unique stresses of a particular garment design (like a very tight-fitting bodysuit or a draped skirt).
Furthermore, chart quality varies dramatically. A reputable, vertically integrated mill will provide a detailed, lab-backed chart. A smaller trading company might offer a simplified, generic sheet. The level of detail is often proportional to the fabric’s complexity and cost. For critical applications, investing in your own lab tests on the final approved sample—comparing it directly to the mill’s chart—is the ultimate safeguard.
Finally, remember that the chart is a living document. If you change the yarn supplier, the dye house, or even the washing instructions for the finished garment, you must re-test and potentially update the specification. The chart represents a specific recipe, and changing an ingredient requires re-evaluation.
Navigating fabric specifications can be daunting. Here are answers to common lingering points:
Ultimately, mastering the knitting fabric chart transforms you from a passive buyer of textiles into an active, informed specifier. It shifts conversations from vague feelings of “this feels wrong” to precise, data-driven discussions about loop density, yarn count, and dimensional stability. In the complex ecosystem of apparel production, that clarity is your most valuable asset.
Helpful tip: The Complete Guide to Blue Sweatshirt Fabric: Materials, Properties, and Sourcing